

Profit Probability
- Actual Profits
| Revenue | Expenses | Actual Profits | Budgeted Profits | |
| 2013 | ₤ 316,449,668.60 | ₤ 313,395,191.59 | ₤ 3,054,477,.01 | ₤ 3,046,000.00 |
| 2014 | ₤ 354,423,628.83 | ₤ 344,734,710.74 | ₤ 9,688,918,09 | ₤ 9,561,000.00 |
| 2015 | ₤ 396,954,464.29 | ₤ 379,208,181.82 | ₤ 17,746,282.47 | ₤ 18,155,000.00 |
- Likely Profits
| Budgeted Revenue | Budgeted Expenses | Likely Profits | |
| 2016 | ₤ 436,447,382.93 | ₤ 411,592,351.61 | ₤ 24,855,031.32 |
- The law of probability
The probability is equal to the number of ways a particular event could occur, rather than a public event, and divided by the total number of possible events. In other words, probability measures the likelihood of an event occurring.
How to calculate profit
Part 1
- The equation to calculate the profit
Total Revenue – (Cost of goods sold + Operation expenses) = Profit
- How many pushchairs does John need to sell to break even?
Pushchair = Y
Total Earning = Total Cost
₤ 450 x Y = ₤ 350 x Y + ₤ 800
Y= 8 (= 8 pushchairs)
- Profit/Loss
Profit = ₤ 450 x 23 – (₤350 x 23 + ₤ 800)
= 10,350 – (8,050 + 800)
= 10,350 – 8,850
=1,500 (= ₤ 1,500) Profit
Part 2
- The equation to calculate the profit
Total Revenue – (Cost of goods sold + Operation expenses) = Profit
- How many items does Hector need to sell to break even?
Y = Quantity
Total Earning = Total Cost
₤ 1 x Y = ₤ 0.90 x Y + ₤ 2000
0.1Y = 2000
Y = 20,000
- Profit/Loss
Profit = ₤ 1 x 15000 – (₤ 0.90 x 15000 + 2000)
= 15,000 – (13,500 + 2,000)
= 500 (= ₤ 500) Loss
What is Maximum Profit?
Part 1
- Maximum Profit
Companies need to estimate or be aware of the cost and number of profits, product sales, and business profits at various price levels to achieve maximum profit.
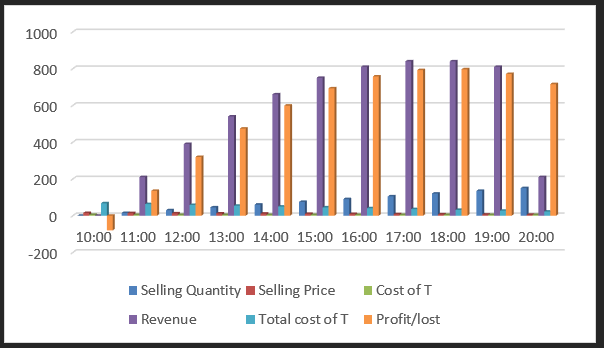
Price and profit for the fee ranging from ₤ 15 to ₤ 3
| Time | Selling Quantity | Selling Price | Cost of T | Revenue | The total cost of T | Profit/lost |
| 10:00 | 0 | 15 | 4.5 | 0 | 67.5 | -79.4 |
| 11:00 | 15 | 14 | 4.5 | 210 | 63 | 135.1 |
| 12:00 | 30 | 13 | 4.5 | 390 | 58.5 | 319.6 |
| 13:00 | 45 | 12 | 4.5 | 540 | 54 | 474.1 |
| 14:00 | 60 | 11 | 4.5 | 660 | 49.5 | 598.6 |
| 15:00 | 75 | 10 | 4.5 | 750 | 45 | 693.1 |
| 16:00 | 90 | 9 | 4.5 | 810 | 40.5 | 757.6 |
| 17:00 | 105 | 8 | 4.5 | 840 | 36 | 792.1 |
| 18:00 | 120 | 7 | 4.5 | 840 | 31.5 | 796.6 |
| 19:00 | 135 | 6 | 4.5 | 810 | 27 | 771.1 |
| 20:00 | 150 | 5 | 4.5 | 210 | 22.5 | 715.6 |
- A Graph to present the profit
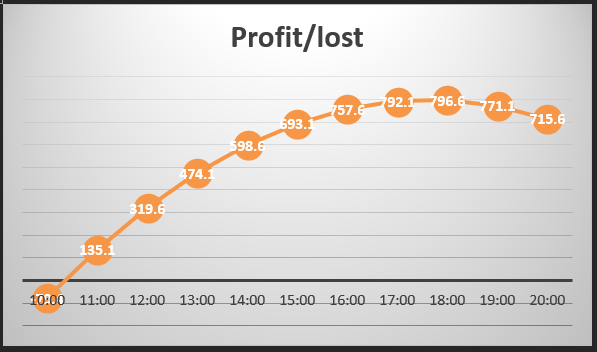
- Maximum possible profit / Selling price
Maximum profit: ₤ 808.50
Selling Price for the maximum profit: ₤ 7
Part 2
- Price and profit/loss
| Price | Amount sold | Cost of Cherries | Total Revenue | Total Cost | Profit |
| 4 | 20 | 0.65 | 80 | 13 | 67 |
| 3 | 60 | 0.65 | 180 | 39 | 141 |
| 2.5 | 80 | 0.65 | 200 | 52 | 148 |
| 2 | 100 | 0.65 | 200 | 65 | 135 |
| 1.5 | 120 | 0.65 | 180 | 78 | 102 |
| 1 | 140 | 0.65 | 140 | 91 | 49 |
- Price and profit/loss
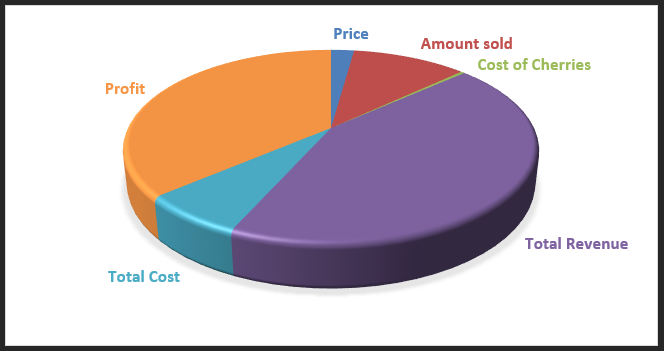
- Optimal Selling Price
Optimal selling price: ₤ 2.5
References
- Andrea Farkas, 2017. The Law of Probability. [online] Available at: <https://sciencing.com/ law-probability-8657085.html> [Accessed 3 January 2022].
- Madison Garcia, 2018. How to Calculate Maximum Profit. [online] Available at: <https://bizfluent.com/how-5989108-calculate-maximum-profit.html> [Accessed 3 January 2022].
- CFI, 2022. What is the EV/Gross Profit Ratio? [online] Available at: <https://corporatefinanceinstitute.com/resources/knowledge/finance/ev-gross-profit-ratio/> [Accessed 25January 2022].